In this chapter, we perform data processing and analysis tasks, including filtering, recoding values, formatting string variables, creating date durations, joining tables, and counting rows using SQL. COVID-19 data are utilized to generate summary calculations such as counts, sum, and percentage of events across different patient groups.
── Conflicts ────────────────────────────────────────── tidyverse_conflicts() ──
✖ dplyr::filter() masks stats::filter()
✖ dplyr::lag()    masks stats::lag()
ℹ Use the conflicted package (<http://conflicted.r-lib.org/>) to force all conflicts to become errors
Connect to DuckDB database
# Close any existing connections firstif (exists("con")) {try(dbDisconnect(con), silent =TRUE)}# Connect to DuckDB databasecon <-dbConnect( duckdb::duckdb(),dbdir ="/Users/nnthieu/SyntheaData/SyntheaCovid19/synthea19.duckdb")
Verify tables
# Load the PostgreSQL extensiondbExecute(con, "INSTALL postgres; LOAD postgres;")
q1 <-"SELECT COUNT(DISTINCT PATIENT) AS patients_counts FROM encounters WHERE EXTRACT(YEAR FROM START) = 2020 ; " df1 <-dbGetQuery(con,q1)head(df1)
  patients_counts
1           98400
4.3.0.2Count total patients diagnosed with COVID-19 in the year 2020
First, identify COVID-19 patients in the conditions table where code = '840539006', which represents a COVID-19 diagnosis.
q2 <-"SELECT DISTINCT PATIENT AS covid_patient_ids FROM conditions WHERE CODE = '840539006' AND EXTRACT(YEAR FROM START) = 2020 "covid_patient_ids =dbGetQuery(con, q2)print(head(covid_patient_ids))
cat("Number of COVID-19 patients:", nrow(covid_patient_ids), "\n")
Number of COVID-19 patients: 88166
List of the covid19 patients in year 2020
q3 <-"SELECT DISTINCT PATIENT AS covid_patient_ids FROM encounters WHERE REASONDESCRIPTION = 'COVID-19' AND EXTRACT(YEAR FROM START) = 2020 "covid_patient_ids =dbGetQuery(con, q3)print(head(covid_patient_ids))
cat("Number of COVID-19 patients:", nrow(covid_patient_ids), "\n")
Number of COVID-19 patients: 18180
However, there are just 18,180 patients with covid-19 diagnosis seeing care via encounters. The reason is that the patients with covid-19 diagnosis are not always seen in the encounters table.
q4 <-"SELECT COUNT(DISTINCT PATIENT) AS covid19_counts FROM encounters WHERE REASONDESCRIPTION = 'COVID-19' AND EXTRACT(YEAR FROM START) = 2020 ; "dbGetQuery(con, q4)
  covid19_counts
1          18180
4.3.0.3Count total patients with covid-19 in year 2020 by age group
In this example, we join two tables, create an ‘age’ column based on the date of birth and the date of COVID-19 infection, then recode ‘age’ into age groups, and count the number and percentage of distinct patients who contracted COVID-19 in each age group.
q5 <-"SELECT age_group, COUNT(DISTINCT id) AS covid_patient_count, ROUND( COUNT(DISTINCT id) * 100.0 / SUM(COUNT(DISTINCT id)) OVER (), 2 ) AS percent_of_totalFROM ( SELECT p.id, CASE WHEN DATEDIFF('day', p.birthdate, c.start) / 365.25 < 18 THEN '0-17' WHEN DATEDIFF('day', p.birthdate, c.start) / 365.25 BETWEEN 18 AND 34 THEN '18-34' WHEN DATEDIFF('day', p.birthdate, c.start) / 365.25 BETWEEN 35 AND 49 THEN '35-49' WHEN DATEDIFF('day', p.birthdate, c.start) / 365.25 BETWEEN 50 AND 64 THEN '50-64' ELSE '65+' END AS age_group FROM conditions c LEFT JOIN patients p ON c.patient = p.id WHERE c.code = '840539006' AND EXTRACT(YEAR FROM c.start) = 2020) subGROUP BY age_groupORDER BY age_group;"results =dbGetQuery(con, q5)print(results)
4.3.0.5Patients recovered from covid-19 whose covid-19 status is negative after home isolation
q7 <-"SELECT COUNT(DISTINCT c.patient) AS recovered_patients,ROUND(100.0 * COUNT(*) / (SELECT COUNT(DISTINCT patient) FROM conditions WHERE code = '840539006'), 2) AS percent_of_home_covid_recovered_patientsFROM careplans cLEFT JOIN observations o ON c.patient = o.patientWHERE c.code = '736376001' AND c.reasoncode = '840539006' AND c.stop IS NOT NULL AND o.code = '94531-1' AND o.value = 'Not detected (qualifier value)';"dbGetQuery(con, q6)
4.3.0.6Health outcomes experienced by COVID-19 patients
This example shows how to recode string values into categories using CASE statements, join tables to link COVID-19 patients with their health outcomes, and aggregate the results to count the number and percentage of patients experiencing each outcome.
q7. <-"WITH covid_patients AS ( SELECT DISTINCT patient FROM conditions WHERE code = '840539006'),outcome_patients AS ( SELECT DISTINCT patient, CASE WHEN description ILIKE '%sepsis%' THEN 'Sepsis' WHEN description ILIKE '%septic shock%' THEN 'Septic Shock' WHEN description ILIKE '%respiratory failure%' THEN 'Respiratory Failure' WHEN description ILIKE '%Respiratory distress%' THEN 'Respiratory distress' WHEN description ILIKE '%acute cardiac injury%' THEN 'Acute Cardiac Injury' WHEN description ILIKE '%heart failure%' THEN 'Heart Failure' WHEN description ILIKE '%pneumonia%' THEN 'Pneumonia' WHEN description ILIKE '%acute kidney failure%' THEN 'Acute Kidney Failure' WHEN description ILIKE '%Acute pulmonary embolism%' THEN 'Acute pulmonary embolism' END AS outcome FROM conditions WHERE description ILIKE '%sepsis%' OR description ILIKE '%septic shock%' OR description ILIKE '%respiratory failure%' OR description ILIKE '%Respiratory distress%' OR description ILIKE '%acute cardiac injury%' OR description ILIKE '%heart failure%' OR description ILIKE '%pneumonia%' OR description ILIKE '%acute kidney failure%' OR description ILIKE '%Acute pulmonary embolism%'),covid_with_outcomes AS ( SELECT cp.patient, op.outcome FROM covid_patients cp JOIN outcome_patients op ON cp.patient = op.patient)SELECT outcome, COUNT(DISTINCT patient) AS patient_count, ROUND(100.0 * COUNT(DISTINCT patient) / (SELECT COUNT(*) FROM covid_patients), 2) AS percent_of_covid_patientsFROM covid_with_outcomesGROUP BY outcomeORDER BY percent_of_covid_patients DESC;"dbGetQuery(con, q7)
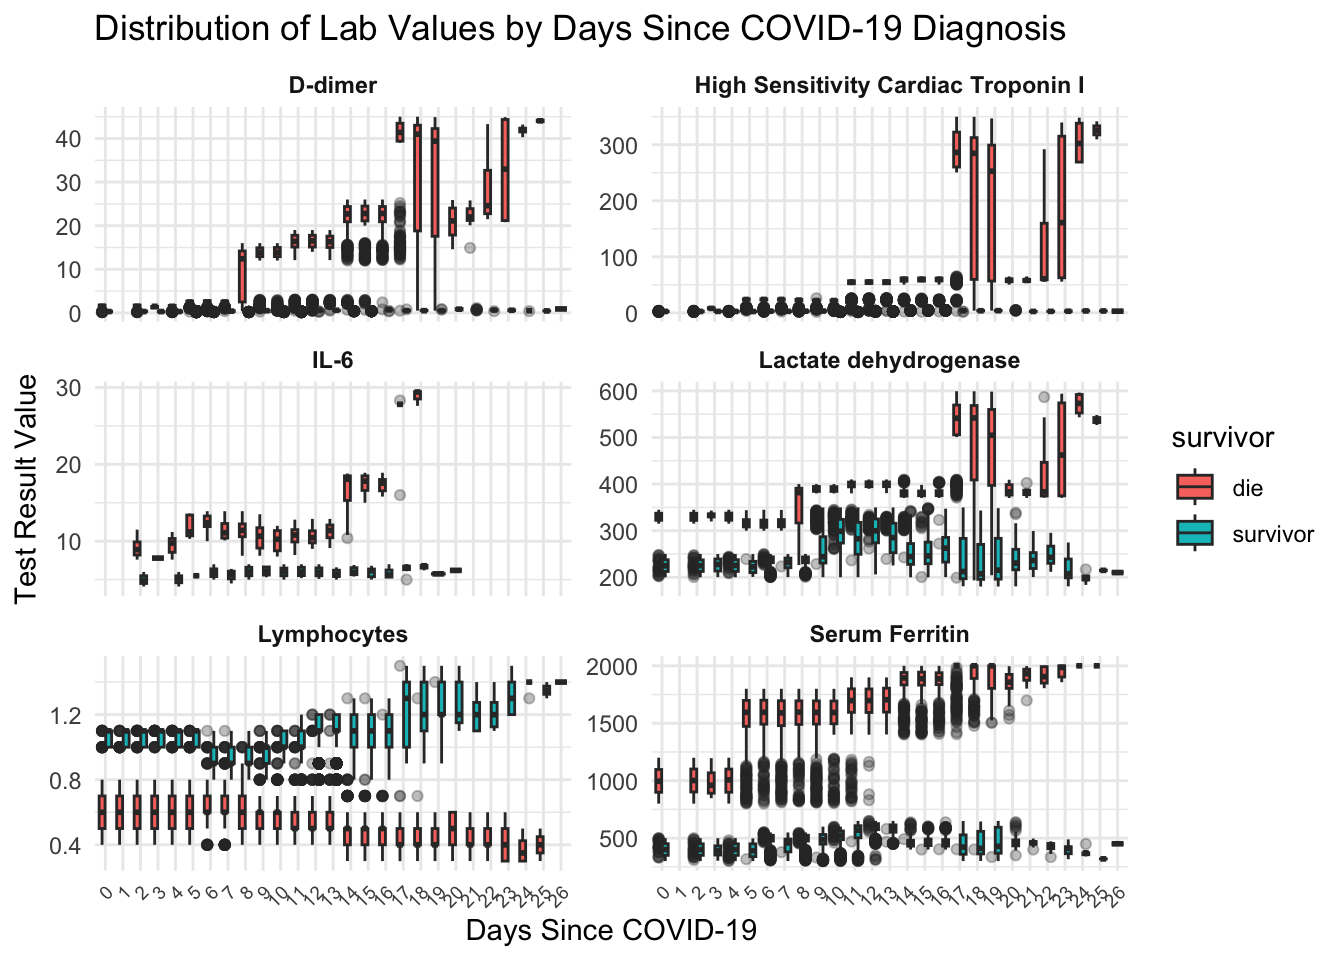
This example demonstrates how to recode ‘lab code’ values into descriptive test names using CASE statements, filter specific lab values needed for insights, join multiple tables to link COVID-19 patients with their lab results, calculate the duration since COVID-19 diagnosis, and categorize patients based on their survival status.
q8 <-"SELECT o.date, o.patient, o.encounter, o.code, o.value, o.units, CASE o.code WHEN '48065-7' THEN 'D-dimer' WHEN '2276-4' THEN 'Serum Ferritin' WHEN '89579-7' THEN 'High Sensitivity Cardiac Troponin I' WHEN '26881-3' THEN 'IL-6' WHEN '731-0' THEN 'Lymphocytes' WHEN '14804-9' THEN 'Lactate dehydrogenase' ELSE NULL END AS test, c.start, o.date - c.start AS covid_days, c.code AS con_code, c.description AS con_description, CASE WHEN p.deathdate IS NULL THEN 'survivor' ELSE 'die' END AS survivorFROM observations oLEFT JOIN conditions c ON o.patient = c.patientLEFT JOIN patients p ON o.patient = p.idWHERE c.code = '840539006' AND o.code IN ('48065-7', '26881-3', '2276-4', '89579-7', '731-0', '14804-9')"labs_covid19 <-dbGetQuery(con, q8)head(labs_covid19, 5)
library(ggplot2)options(repr.plot.width =21, repr.plot.height =17) ggplot(labs_covid19, aes(x =as.factor(covid_days), y =as.numeric(VALUE), fill = survivor)) +geom_boxplot(outlier.alpha =0.3) +facet_wrap(~ test, scales ="free_y", ncol =2, nrow =3) +labs(title ="Distribution of Lab Values by Days Since COVID-19 Diagnosis",x ="Days Since COVID-19",y ="Test Result Value" ) +theme_minimal() +theme(axis.text.x =element_text(angle =45, hjust =1, size =7),strip.text =element_text(face ="bold") )
4.3.0.8Symptoms experienced by COVID-19 patients
q9 <-"WITH covid_patients AS ( SELECT DISTINCT patient FROM conditions WHERE code = '840539006'),patient_symptoms AS ( SELECT c.description FROM conditions c JOIN covid_patients cp ON c.patient = cp.patient WHERE LOWER(c.description) NOT IN ( 'covid-19', 'suspected covid-19', 'body mass index 30+ - obesity (finding)', 'prediabetes', 'hypertension' ) AND LOWER(c.description) NOT LIKE '%chronic%' AND LOWER(c.description) NOT LIKE '%anemia%' AND LOWER(c.description) NOT LIKE '%Hypoxemia%')SELECT description, COUNT(*) AS symptom_count, ROUND(100.0 * COUNT(*) / (SELECT COUNT(*) FROM patient_symptoms), 2) AS percentFROM patient_symptomsGROUP BY descriptionORDER BY symptom_count DESCLIMIT 14;"symptoms =dbGetQuery(con,q9)symptoms
q10 <-"WITH covid_patients AS ( SELECT DISTINCT patient FROM conditions WHERE code = '840539006')SELECT c.description, ROUND(AVG(EXTRACT(DAY FROM c.stop) - EXTRACT(DAY FROM c.start)), 2) AS avg_durationFROM conditions cJOIN covid_patients cp ON c.patient = cp.patientWHERE c.stop IS NOT NULL AND c.start IS NOT NULLAND c.description IN ('Fever (finding)', 'Cough (finding)' ,'Loss of taste (finding)' ,'Fatigue (finding)', 'Sputum finding (finding)')GROUP BY c.descriptionORDER BY avg_duration DESC;"symptom_length <-dbGetQuery(con, q10)print(symptom_length)
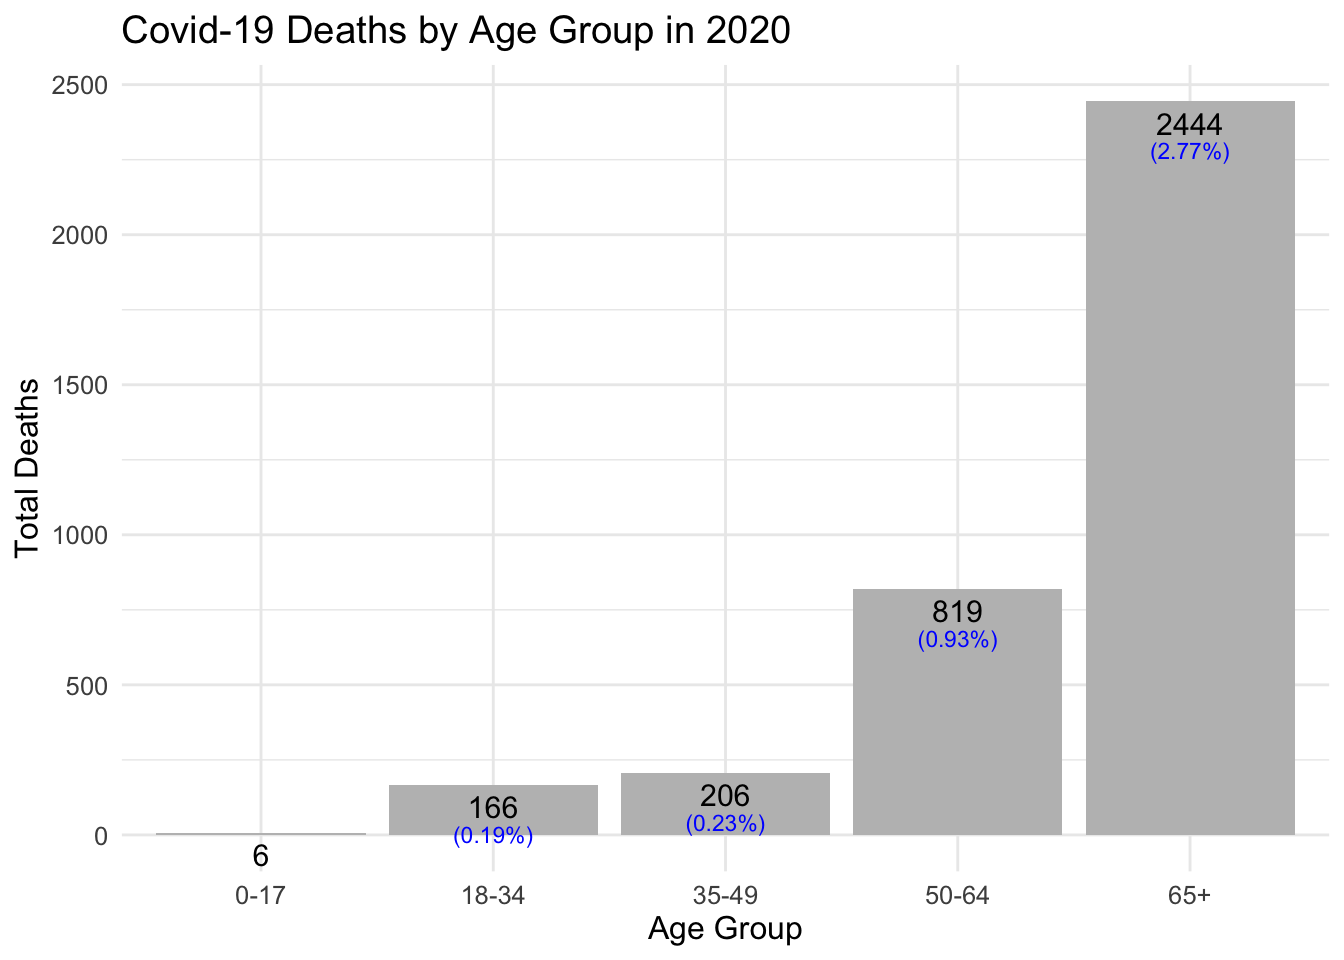
q11 <-"SELECT CASE WHEN age < 18 THEN '0-17' WHEN age BETWEEN 18 AND 34 THEN '18-34' WHEN age BETWEEN 35 AND 49 THEN '35-49' WHEN age BETWEEN 50 AND 64 THEN '50-64' ELSE '65+' END AS age_group, COUNT(DISTINCT id) AS death_count, ROUND(100.0 * COUNT(DISTINCT id) / (SELECT COUNT(DISTINCT patient) FROM conditions WHERE code = '840539006'), 2) AS percent_of_covid_patientsFROM ( SELECT p.id, DATE_PART('year', c.start) - DATE_PART('year', p.birthdate) AS age FROM patients p JOIN conditions c ON p.id = c.patient WHERE c.code = '840539006' AND p.deathdate IS NOT NULL AND EXTRACT(YEAR FROM c.start) = 2020) AS covid_deathsGROUP BY age_groupORDER BY age_group;"age_deaths =dbGetQuery(con, q11)print(age_deaths)
4.3.0.11Visualize deaths with COVID-19 by age-group
ggplot(age_deaths, aes(x = age_group, y = death_count)) +geom_bar(stat ="identity", fill ="gray") +geom_text(aes(label =round(death_count, 2)),vjust =1.5, # Puts the count inside the barcolor ="black", # White text for countsize =4 ) +geom_text(aes(label =paste("(", round(percent_of_covid_patients, 2), "%)", sep ="")),vjust =3.5, # Puts the percentage below the countcolor ="blue", # White text for percentagesize =3 ) +labs(title ="Covid-19 Deaths by Age Group in 2020",x ="Age Group",y ="Total Deaths" ) +theme_minimal() +theme(text =element_text(size =12))
4.4 Conclusion
In summary, this chapter demonstrated how to process and analyze healthcare data using SQL techniques. By applying filtering, transformation, and aggregation methods, we successfully derived meaningful insights from COVID-19 patient data to support further analysis and reporting.